Working with Models
- Purpose of models is to classify or predict data using algorithms
20 years ago, it was pretty clear which types of work a computer could do better than a human. Anything involving number crunching with lots of data and quick turn around would be a great task to run on a computer. On the other hand, what if you wanted to save pictures from your island vacation and select the best ones to remember the trip by? You would have gone through hundreds of pictures individually to pick out the keepers. Smiling family, beautiful scenery, and action would be considered while blurry pictures and duplicates would be removed. Surely this would have been too subjective for a computer to weigh in.
Fast forward to today. The best vacation pictures you want to keep probably share some features with the millions of other pictures that are being taken. Why don't we tell a computer what to look for and it can do the work for us?

Types of machine learning and some new terminology
If we are going to train a computer to be a good judge of vacation photos, we will have to be able to describe this in a way that it understands. A program with a bunch of if/else statements are not going to serve us well here. What we need is a model, and not the runway walking variety!
A model is an algorithm that can take input and predict what the output represents. It does this based on features, representing characteristics we have deemed important to distinguish good photos from bad. The predictions it gives are labels that describe the output in terms of our machine learning goals. In this case, it would be 'good vacation photo' or 'bad vacation photo'. If our goal is to label pictures in a way that is better than average, these general labels might be enough — most likely, however, we will want to be approximately correct with what a family member would select from the vacation. In this case, more specific labels would be used.
Determining what the model should look like follows the paths of supervised learning and unsupervised learning. The former, supervised learning, is when we act as the teacher showing the signals for correct output. In our example, this would mean providing photos that are labeled correctly with what the computer should be able to predict once trained. Unsupervised learning will look at the data without any guidance and instead will come back with patterns that are recognized. There are tradeoffs with both techniques but with machine learning, supervised learning is preferred when possible.
Let's use some visualization to drive this terminology home.
Supervised learning

- Data points
- Labels
- Features
- Separating hyper plane
While greatly simplified, the diagram above is the stuff hundreds of books and PHds are written about, so take note! Here a set of data points are grouped into two clouds. These are represented in a 2-dimensional space, which means each point has both an x1 and an x2.
Mini quiz 1
  Can you determine what are the _labels_ in this diagram?

  Can you determine what are the _features_?
Insights
The model described above is performing classification. Note that the point clouds are color coded with two different label colors. Orange and green are the labels. The spacial dimensions where the points live represent the magnitude of selected features, x1 and x2. The purpose of building this model is to arrive at the heart of machine learning, which is the separating hyper plane drawn as a blue line. Using this it is easy to determine how to label data points based on which side of the line they land on.
Using the model after training
Now that the model has been trained, let's see what happens when a new data point arrives.
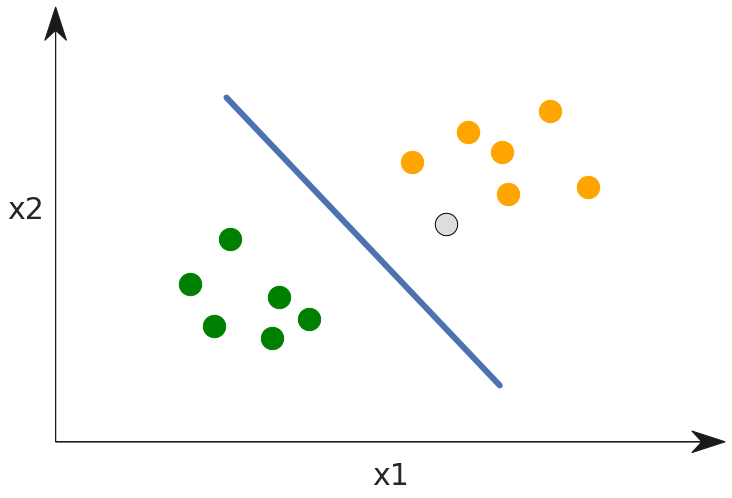
Here the grey dot represents a new data point where we don't know the label. By using the model, we can find which side of the line the point falls on and see it should be given the orange label.
Unsupervised learning
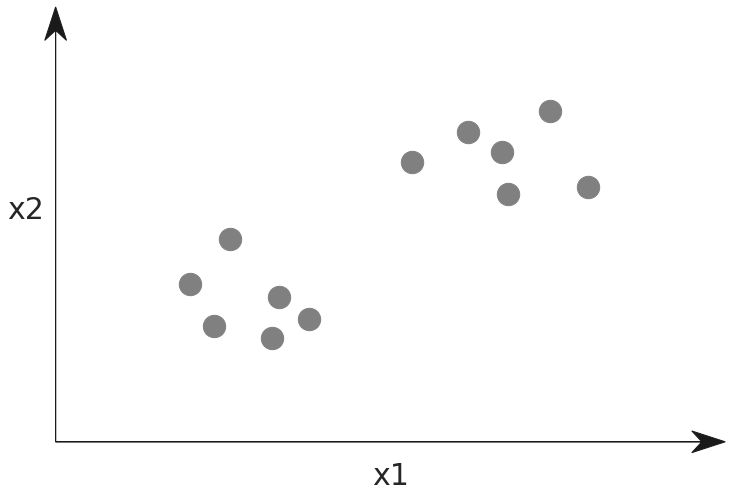
To compare unsupervised learning, we would have data points but there would be no labels given. This is represented below by making all the data points grey. The model would be trained to find patterns in the data and decide on what makes it interesting or related.
In practice
Here are some examples of machine learning classifiers in each category:
Supervised Learning: Decision Tree, Random Forest, Boosting, SVM, logistic regression
Unsupervised Learning: K-means, mean shift, PCA, ICA
Deep Learning
Where does deep learning fit into this? Is it supervised, unsupervised, or something else altogether? Give that some thought.
Deep Learning has classifiers and techniques that can be used as supervised Deep Learning and unsupervised Deep Learning. There are even semi-supervised learning strategies. We will get into deep learning in the following lesson. For now, it is enough to know that certain methods such as Convolutional Neural Networks (CNNs) are supervised, while others such as Auto-encoders are unsupervised..
Selecting and evaluating features
Developing the machine learning model involves the selection of features, and some examples will show why this is important. Imagine that the data points represent apples and oranges and that we select roundness and weight as features.
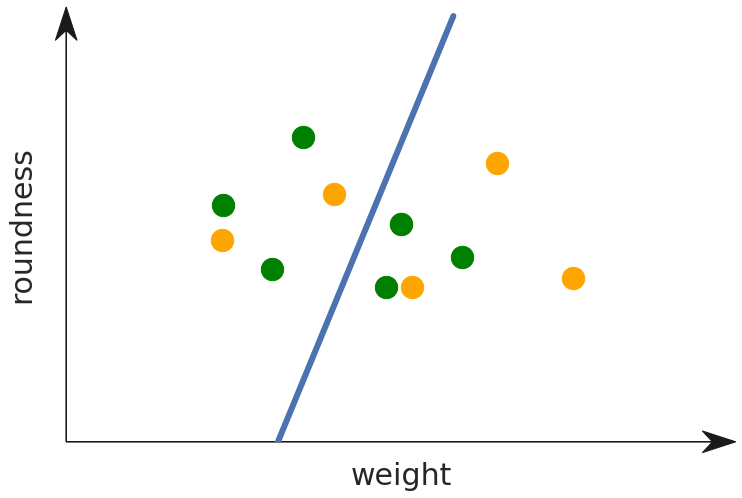
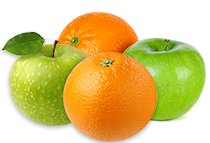
You can see that this feature selection is not very useful as it gives very little signal for determining if a fruit is an apple or an orange. What if instead we decide to classify based on shape and color?
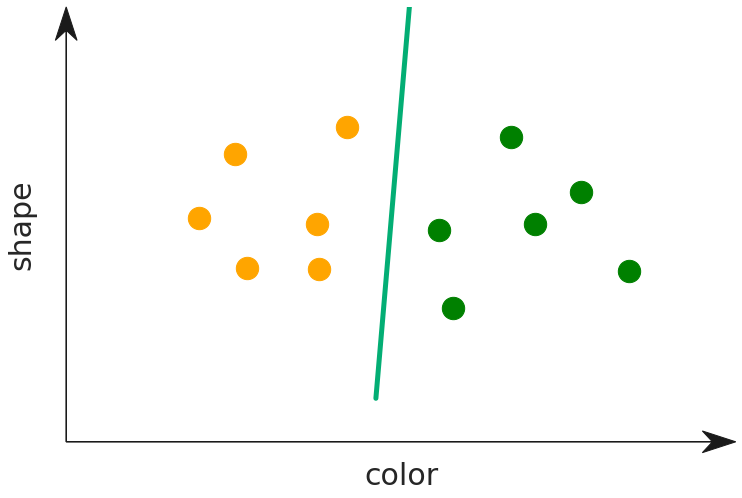
Now that we are using color as a feature, the model is much more useful and determining the label for the type of fruit. The point clouds now lie cleanly on each side of the dividing line. Meanwhile, how about shape? The slope of the line tells us something here. It is nearly orthgonal with the axis for color, and parallel with shape. This tells us that shape is not a good predictor of the type of fruit. Intuitively this makes sense, and using the graph you can prove this to yourself as well. Imagine that we shuffle the points along the shape axis — they would still fall cleanly on the same side of the line.
Exercise
Load the data science docker and start Jupyter. Review the instructions to do this, if needed.
We are going to work with a training dataset for determining malicious websites based on different criteria. Download the dataset, and make it available to load in your docker. Do this by putting it in the directory from where you start the docker instance. This folder loads as the /srv mount path and then you can call .read_csv('/srv/dataset.csv'), in your python notebook to load it..
Here is a link to a Jupyter notebook to see various summaries of this data, as well as discovering the separating hyper plane between websites that are malicious, and those that are safe.
This dataset and Jupyter notebook come from the Kaggle website. Read the description for the dataset as mentioned on the Kaggle project page. This will give you a better idea of what the columns mean.